TDS Measurement Protocols for Home Use
TDS Measurement Protocols for Home Use: A Comprehensive Guide
Understanding TDS and Its Role in Water Quality
Total Dissolved Solids (TDS) refer to the combined concentration of inorganic and organic substances dissolved in water. These include minerals, salts, metals, and even trace contaminants. Measured in parts per million (ppm), TDS levels provide insight into water purity and taste. While some dissolved solids, like calcium and magnesium, are beneficial, excessively high TDS can indicate potential issues such as heavy metals or pollutants. For home users, monitoring TDS helps assess filtration system efficiency, track plumbing corrosion, or evaluate drinking water safety. The World Health Organization suggests ideal drinking water TDS levels between 50–300 ppm, though regional guidelines may vary.

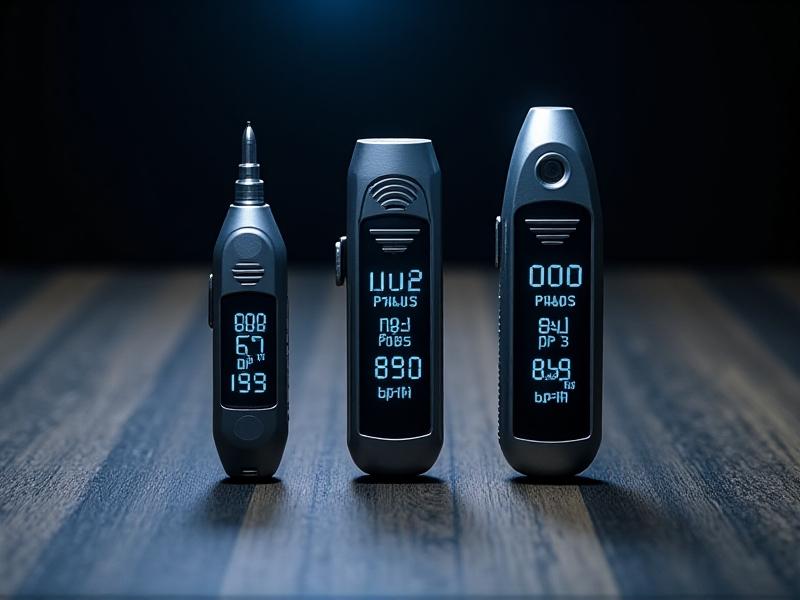
Selecting a Reliable TDS Meter for Home Testing
When choosing a TDS meter, prioritize devices with automatic temperature compensation (ATC) to account for water’s thermal variations. Look for a readability range of 0–9999 ppm to accommodate both purified and hard water scenarios. Handheld digital models with LCD screens, such as those using electrical conductivity principles, offer portable and instantaneous results. Key features to compare include calibration capabilities (ideally with NaCl solutions), battery life, and waterproof construction. User reviews and third-party certifications like NSF/ANSI standards provide additional assurance of accuracy. Budget-friendly options under $30 often suffice for casual use, while advanced models with data logging suit enthusiasts tracking long-term trends.
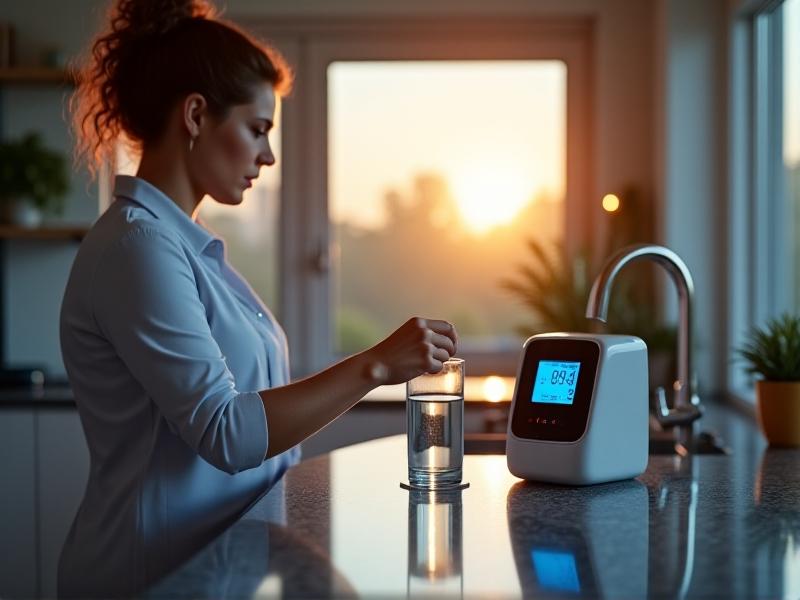
Step-by-Step Guide to Accurate TDS Measurement
Begin by rinsing the meter’s probe with distilled water to remove residue. Activate the device and immerse the sensor fully into a clean water sample, ensuring no air bubbles cling to the electrodes. Gently stir the meter for 10–15 seconds until the reading stabilizes. For tap water assessments, let the faucet run for 30 seconds before collecting samples to avoid stagnant pipe water. Always test multiple times—morning and evening measurements can reveal fluctuations from household usage or temperature changes. Document results alongside variables like water source (tap, filtered, or bottled) and recent plumbing changes. For validation, periodically test distilled water (expected 0–2 ppm) or calibration solutions to verify meter performance.

Decoding Your TDS Readings: What the Numbers Mean
Readings below 50 ppm typically indicate highly purified water, common in reverse osmosis systems. The 50–150 ppm range is ideal for balanced mineral content and palatability. Between 150–250 ppm, water remains generally safe but might leave scale deposits. Levels exceeding 500 ppm suggest concerning contamination or excessive hardness, warranting further investigation with detailed water quality tests. Note that TDS alone doesn’t identify specific contaminants—a 300 ppm reading from calcium differs significantly from one containing lead. Seasonal variations matter: summer may increase TDS in well water due to evaporation, while spring runoff could dilute concentrations.
Calibration and Maintenance Best Practices
Calibrate meters monthly using 342 ppm NaCl solution—the industry standard. Adjust the device following manufacturer instructions if readings drift beyond ±2%. Store meters upright in protective cases to prevent sensor damage, and replace batteries when low-power icons appear. For probes, occasional cleaning with isopropyl alcohol removes oily residues without corroding electrodes. Avoid testing hot water above 50°C, as extreme heat degrades sensors. Keep a logbook tracking calibration dates, battery changes, and any physical impacts that might affect accuracy. Meters used for diverse applications (aquariums, hydroponics, drinking water) benefit from dedicated cleaning between uses to prevent cross-contamination.
Contextualizing TDS Within Broader Water Quality Analysis
While TDS measures total solids, complementary tests provide full water quality insights. pH levels influence how metals dissolve—acidic water (<6.5 pH) with high TDS may leach copper pipes. Chlorine tests reveal disinfectant residuals that TDS meters don’t detect. For comprehensive profiles, pair TDS measurements with hardness kits (calcium/magnesium), heavy metal screens, and biological assays. In gardening, TDS guides nutrient solutions but requires pH adjustments for optimal plant uptake. Remember: low TDS water (e.g., distilled) can be corrosive to plumbing, while high TDS might improve taste by adding electrolytes. Always correlate readings with observable factors like turbidity, odor, or appliance scaling.
Advanced Tips for Consistent TDS Monitoring
Establish a routine testing schedule—weekly for municipal supplies, more frequently for private wells. Map your water system by testing each faucet; variations might reveal localized pipe corrosion. Before and after filter replacements, document TDS to assess cartridge lifespan. For reverse osmosis systems, a >10% increase in post-filter TDS suggests membrane replacement. When traveling, test bottled waters—some brands exceed 500 ppm, while others market ultra-low TDS. Integrate smart home solutions by linking some meters to apps that geo-tag and trend data. Pair TDS tracking with consumption notes: a spike in readings coinciding with metallic tastes validates sensor accuracy and pinpoints emerging issues.