Roast Curve Replication Techniques
The Science Behind Roast Curves and Their Importance
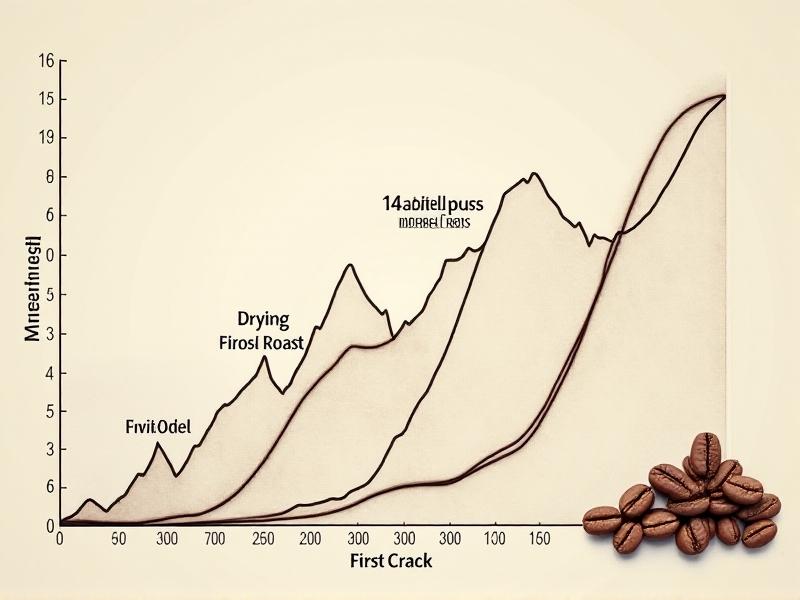
Roast curves are graphical representations of temperature changes during coffee roasting, mapping time against bean temperature. These curves act as blueprints for achieving specific flavor profiles, as chemical reactions like Maillard browning and caramelization occur at precise temperature thresholds. Replicating a roast curve ensures consistency, which is critical for specialty coffee roasters aiming to deliver the same taste experience batch after batch. Minor deviations in time or temperature can alter acidity, body, and aroma, making the science of replication both an art and a technical discipline.
Data Logging: The Foundation of Replication
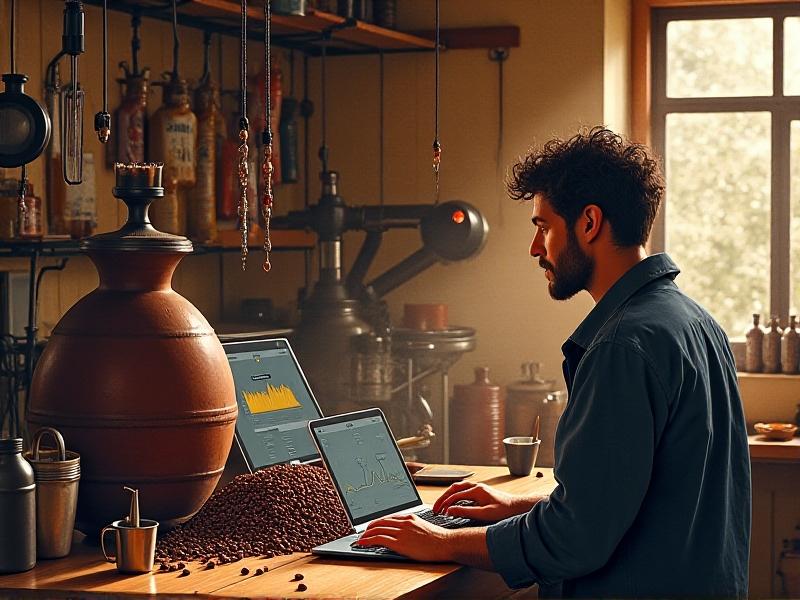
Accurate replication begins with data logging. Probes inserted into the roasting drum or bean mass record temperature at intervals as short as one second. Software like Cropster or Artisan translates this data into visual curves, allowing roasters to compare real-time profiles to target benchmarks. Advanced systems integrate environmental data, such as ambient humidity and airflow, to contextualize temperature shifts. For example, a dip in heat transfer efficiency due to high moisture in green beans can be flagged and adjusted in subsequent batches.
Mastering Variables: Heat, Airflow, and Time
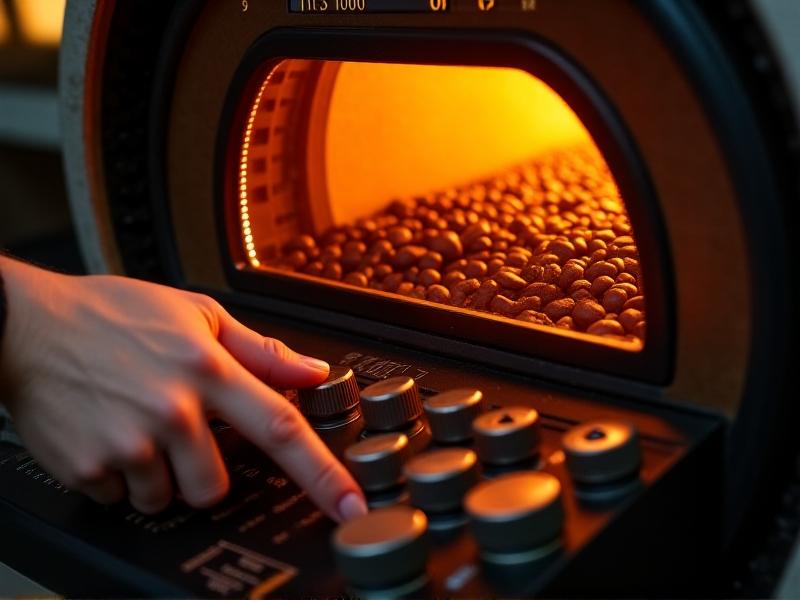
Three variables dominate roast curve replication: heat application, airflow, and time. Increasing heat early in the roast accelerates drying but risks scorching. Reducing airflow during the Maillard phase prolongs sugar browning, enhancing sweetness. Roasters often use a "step-and-hold" approach, where temperature plateaus are interspersed with gradual climbs. For instance, replicating a Nordic light roast might involve rapid early heat to preserve acidity, followed by a steady decline in energy input to avoid overdevelopment.
Technology’s Role: From PID Controllers to AI
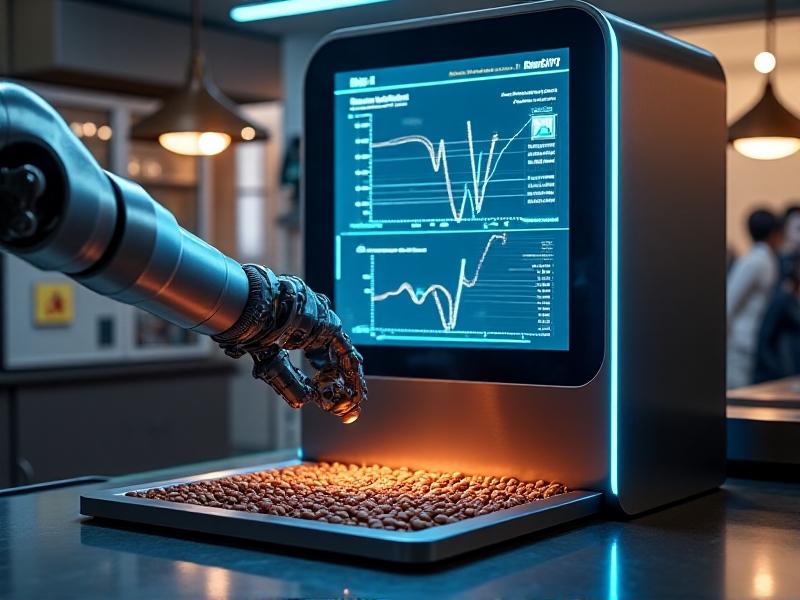
Modern roasters leverage PID (Proportional-Integral-Derivative) controllers to automate heat adjustments, minimizing human error. Machine learning platforms like RoasTime analyze historical data to predict optimal curves for new green coffee lots. Some systems even use infrared sensors to track bean color changes mid-roast, automatically adjusting parameters to align with a target profile. These tools democratize precision, enabling smaller roasteries to match the consistency of large-scale operations.
Challenges in Replication: Bean Variability and Environmental Factors
Even with advanced tools, roasters face hurdles like bean density variations, crop year differences, and shifts in ambient temperature. A Colombian lot harvested during a rainy season may require longer drying phases compared to the previous year’s batch. Some roasteries address this by creating seasonal profile libraries or blending beans to stabilize flavor inputs. Altitude also plays a role—roasting at high elevations may necessitate longer roast times due to lower atmospheric pressure.
Case Study: Replicating a Nobel-Winning Roast Profile
In 2022, Roastery X successfully replicated a profile that won the World Coffee Roasting Championship. Their team deconstructed the original roast’s "development time ratio" (time post-first crack divided by total roast time) and adjusted airflow to mimic the competition machine’s heat retention. They also sourced identical Ethiopian beans from the same cooperative and harvest month. The result was a 98% sensory match, validated by a panel of Q Graders.
The Future: Sustainable Roasting and Smart Curves
Emerging trends focus on sustainability and hyper-personalization. Researchers are developing roast curves optimized for energy efficiency, reducing gas usage by 20% without sacrificing quality. Meanwhile, blockchain-enabled platforms let consumers trace a coffee’s roast profile alongside its origin data. On the horizon are "adaptive curves" that self-adopt to real-time bean mass and moisture readings, ensuring replication even with unpredictable raw materials.