Filter Paper Porosity Comparisons
Understanding Filter Paper Porosity
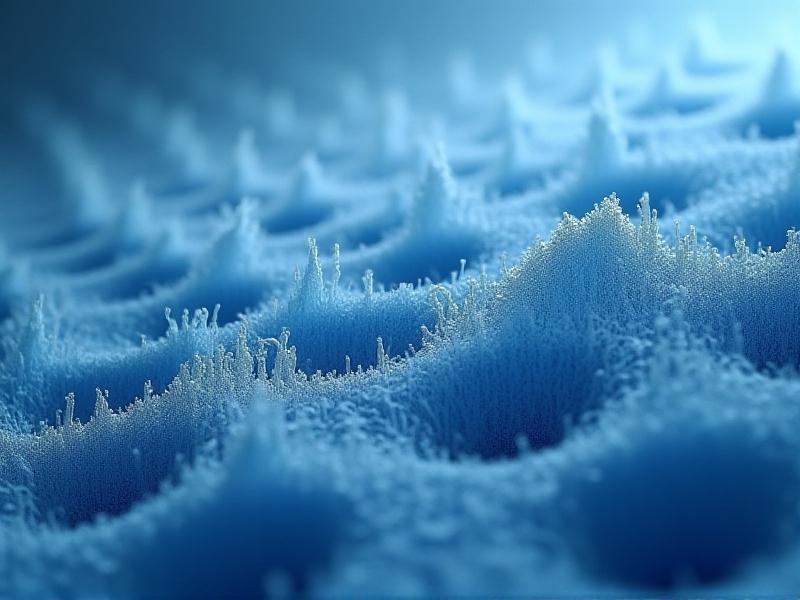
Filter paper porosity refers to the size and distribution of pores within the paper, which determine its ability to retain particles while allowing fluids or gases to pass through. Porosity is a critical factor in filtration efficiency, impacting applications ranging from laboratory research to industrial processes. The pore structure is influenced by the paper's material composition, manufacturing methods, and intended use. For instance, coarse porosity allows faster flow rates but may sacrifice fine particle retention, while finer porosity ensures higher purity but slower filtration.
Grades and Classifications of Filter Paper Porosity
Filter papers are categorized into qualitative and quantitative grades, each designed for specific applications. Qualitative grades, like Whatman Grade 1 (11 µm pores), prioritize flow speed and are used for routine separations. Quantitative grades, such as Whatman Grade 42 (2.5 µm), are ash-free and ideal for gravimetric analysis. Pore sizes range from <1 µm for ultrafiltration to >20 µm for coarse precipitates. Standards like ASTM E832 and ISO 2941 define testing protocols, ensuring consistency across brands like Schleicher & Schuell and Advantec.
The Role of Porosity in Filtration Efficiency
Porosity directly affects a filter’s ability to balance speed and precision. Larger pores enable rapid filtration but risk particle breakthrough, whereas smaller pores trap finer contaminants but may clog quickly. In pharmaceutical settings, 0.2 µm pores ensure sterility by blocking bacteria, while environmental labs use 5 µm filters to collect airborne particulates. The interplay between pore size, particle diameter, and pressure differentials governs efficiency—highlighted by Darcy’s Law, which relates flow rate to permeability.

Comparing Porosity Across Different Filter Paper Types
Cellulose-based papers dominate general lab use due to their affordability and wide porosity range (1–50 µm). Glass microfiber filters, like GF/A (1.6 µm), offer higher chemical resistance and finer retention for HPLC samples. Synthetic membranes, such as PTFE, provide sub-micron porosity and hydrophobic properties. For example, nylon filters (0.45 µm) excel in solvent filtration, while quartz microfiber withstands temperatures up to 500°C. Each type’s porosity profile aligns with distinct operational demands.
Applications and Industry-Specific Porosity Requirements
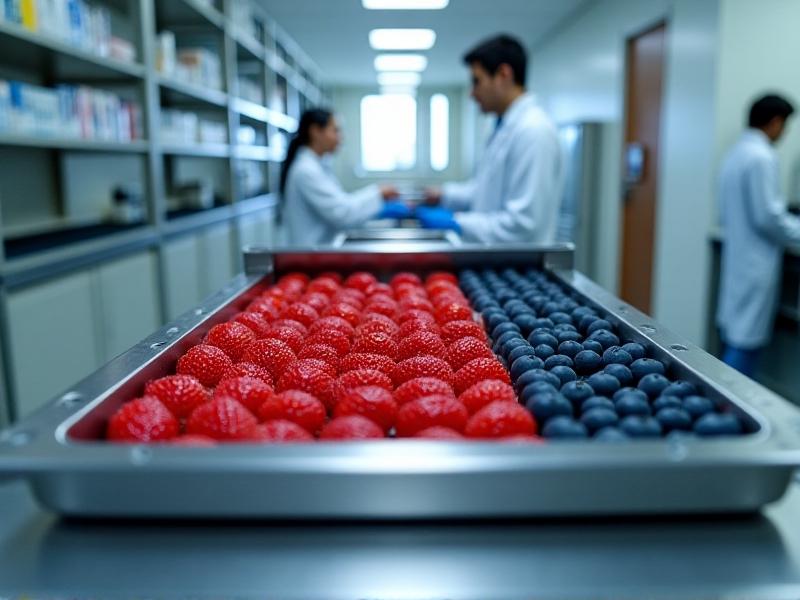
In pharmaceuticals, 0.2 µm sterile filters are mandatory for injectable drugs. Food and beverage industries use 5–10 µm filters to clarify liquids without removing essential flavors. Automotive manufacturers rely on 15 µm cellulose to purify lubricants. Environmental labs employ 0.45 µm glass fiber to capture PM2.5 particles. Even coffee brewing leverages 20 µm metal filters to balance oil retention and sediment removal. These examples underscore how porosity is tailored to industry benchmarks like USP <788> or ISO 8573.
Testing Methods for Determining Porosity
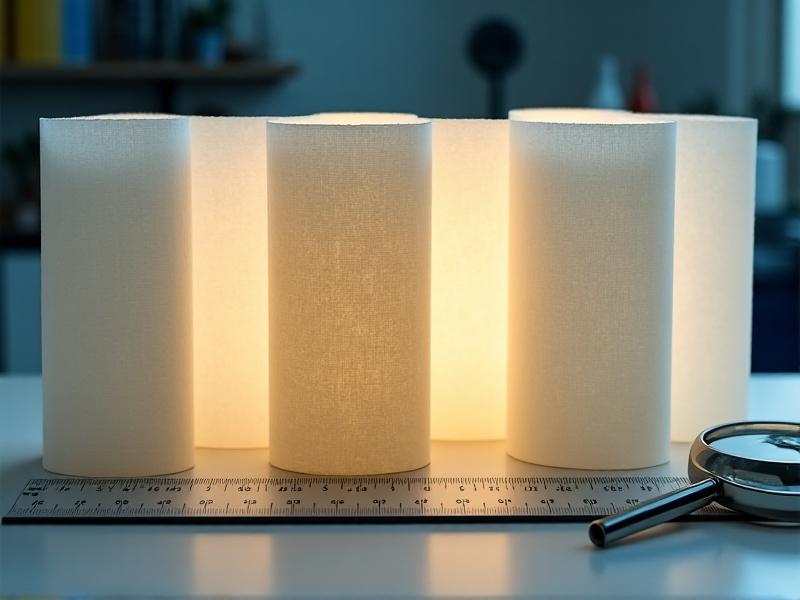
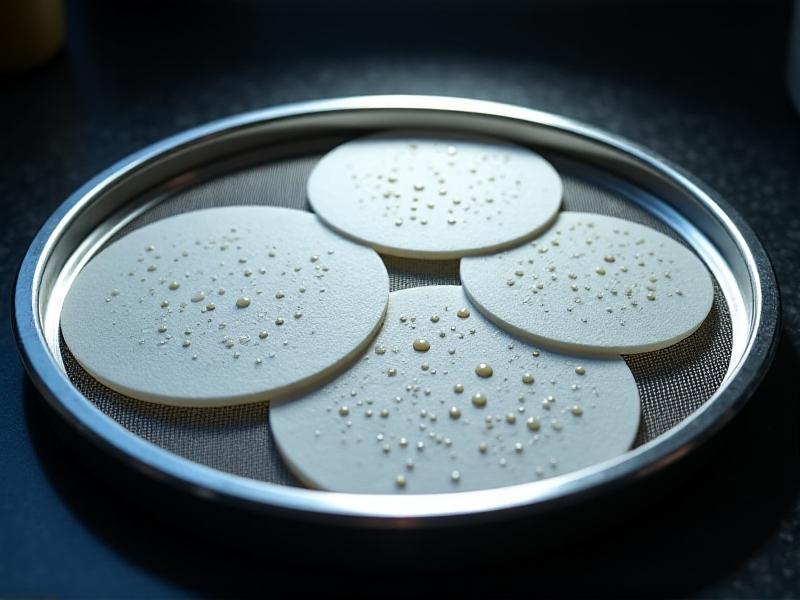
Bubble point testing measures the pressure needed to displace liquid from the largest pore, revealing maximum pore size. Mercury intrusion porosimetry applies high pressure to force mercury into pores, calculating size distribution but risking material damage. Air permeability tests, like the Gurley method, quantify the time for air to pass through a sample, correlating to average porosity. Microscopy provides visual validation but lacks statistical accuracy. Each method has trade-offs in precision, cost, and practicality.
Choosing the Right Porosity for Your Needs
Selecting porosity involves three factors: particle size (choose pores 50–70% smaller than target particles), flow rate requirements (coarser for speed), and chemical compatibility (avoid swelling or degradation). For example, protein solutions require 0.45 µm PVDF to prevent adsorption, while aggresive solvents demand PTFE. Consult manufacturer charts correlating pore size to retention ratings, and validate with pilot tests under real-world conditions.
Impact of Material Composition on Porosity
Cellulose papers swell when wet, reducing effective porosity by up to 20%. Glass microfiber maintains rigidity, preserving pore structure in acidic environments. PTFE’s non-reactive nature suits corrosive fluids but requires support membranes due to flexibility. Hybrid materials, like cellulose-silica composites, enhance mechanical strength without compromising pore uniformity. Material choice thus shapes not only chemical resistance but also porosity stability under operational stress.
Advances in Filter Paper Technology
Nanofiber coatings, such as electrospun polyamide, create submicron pores on conventional cellulose backings, enhancing retention without sacrificing flow. Laser-drilled membranes achieve ±2% pore uniformity for critical assays. Smart filters with embedded sensors monitor clogging in real-time via pressure feedback. Biodegradable options, like polylactic acid (PLA) filters, address sustainability needs. These innovations expand porosity control, enabling precision in emerging fields like nanoparticle synthesis.
Case Studies: Porosity in Action
A biotech firm reduced vaccine production costs by switching from 0.2 µm PES to multilayered cellulose/glass fiber filters, maintaining sterility while doubling flow rates. An environmental agency improved air quality monitoring accuracy using 0.3 µm quartz filters resistant to humidity-induced pore collapse. A craft brewery eliminated off-flavors by adopting 10 µm nylon mesh, balancing yeast removal and aroma preservation. Each case highlights strategic porosity optimization for tangible outcomes.